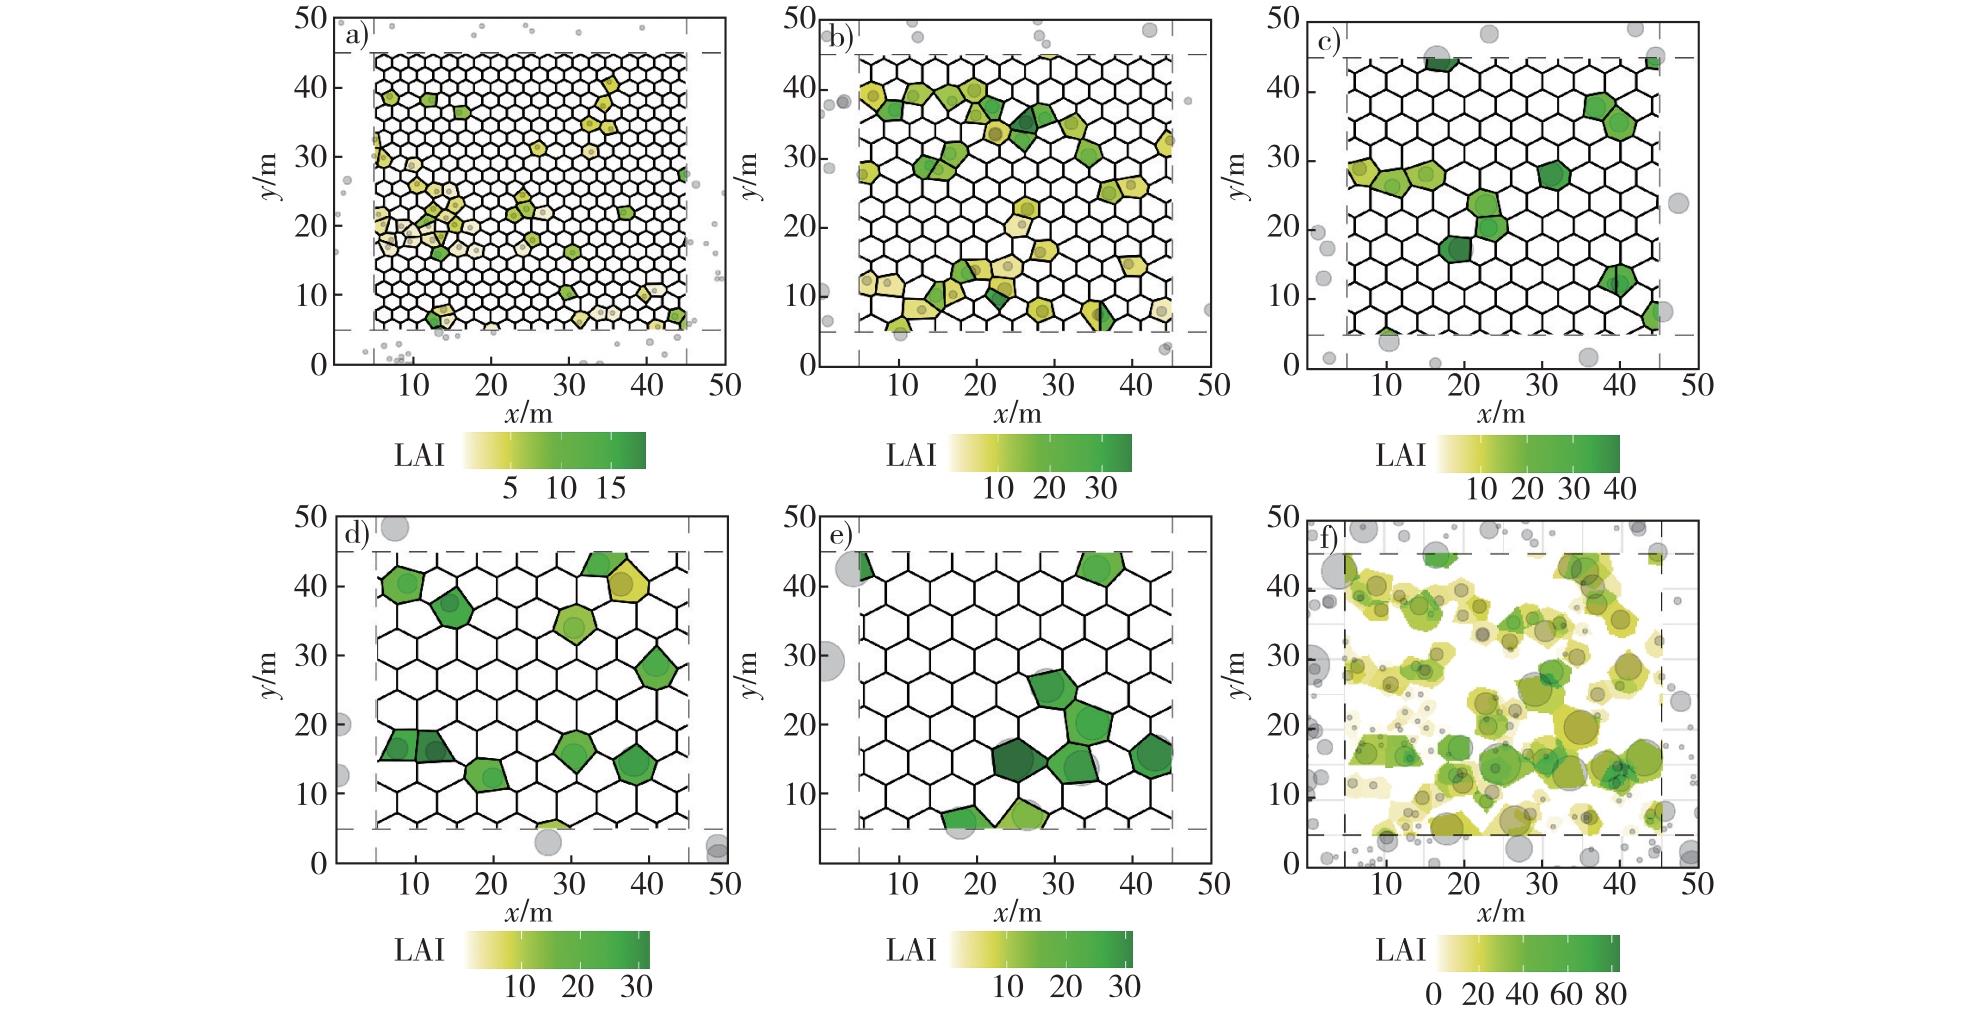
【目的】摸清阔叶红松林中叶面积指数的垂直与短程水平空间分布规律,探索分层Voronoi图法在复层林生态系统叶面积指数空间分布模拟中的应用价值。【方法】以凉水国家级自然保护区核心区内中下坡位的原始阔叶红松林为研究对象,在将阔叶红松林林分内达到起测胸径(5 cm)的林木依据树高分入5个高度(H)级(Ⅰ.H<10 m;Ⅱ.10 m≤H<15 m;Ⅲ.15 m≤H<20 m;Ⅳ.20 m≤H<25 m;Ⅴ.H≥ 25 m)后,以Voronoi图法模拟红松林不同高度级中叶面积指数空间分布,并将各高度级中叶面积指数模拟结果叠加,形成林分总体叶面积指数空间分布模拟结果。在此基础上统计林分尺度上阔叶红松林叶面积指数的总体特征;分析各树种及林分总体的叶面积指数垂直分布规律;基于空间半变异函数及增量空间自相关法分析不同高度级及林分总体叶面积指数的短程水平空间自相关规律。【结果】①研究样地林分总体叶面积指数为10.807,红松(Pinus koraiensis)、色木槭(Acer momo)、白桦(Betula platyphylla)、紫椴(Tilia amurensis)及水曲柳(Fraxinus mandshurica)对林分叶面积指数的贡献居于前5位。林下局部叶面积指数在0~75,其中林下48.7%的区域的叶面积指数为0,而在具有树冠覆盖区域内叶面积指数的概率密度直方图呈峰值在15~25的单峰式分布。②阔叶红松林高度级Ⅰ—Ⅴ叶面积指数分别为0.420、2.420、2.210、2.707及3.050,林分总叶面积指数的垂直分布倾向度为1.171,不同高度级中总叶面积指数的变异系数为47.3%。不同高度级中各树种叶面积指数的变异系数均大于总叶面积的变异系数。在高度级Ⅰ—Ⅴ中,树冠斑块的数量分别为53、39、12、11、8个。随着高度上升,各树种树冠斑块下叶面积指数均呈上升趋势。③阔叶红松林叶面积指数空间半变异函数的块金值、基台值、变程及结构比分别为4.770、164.010、5.108 m及0.029。林分总体及各高度级的叶面积指数均体现为强空间自相关性。在滞后距小于27.0 m及滞后距大于38.5 m时样地内叶面积指数表现为相似聚集,滞后距在27.0~38.5 m范围时叶面积指数表现为空间随机(P<0.05)。随着滞后距的逐渐增加,叶面积指数的Z得分分别在14、24 m出现两处峰值。【结论】处于中下坡位缓坡的阔叶红松林中叶面积指数具有明显的垂直分层特征,不同树种的叶面积倾向分布于不同的高度中,红松、云杉(Picea asperata)、水曲柳等高大乔木的叶面积倾向分布于冠层上方;以槭属(Acer)和榆属(Ulmus)为代表的中乔和小乔木叶面积倾向分布于冠层下部。处于中下坡位缓坡生境的阔叶红松林的叶面积指数在水平方向上具有高度的短程空间自相关性。林分内叶面积指数的水平空间分布在大多数研究尺度下表现为相似性聚集,且受林木空间分布影响强烈。
【Objective】This study aims to investigate the vertical and short-range horizontal spatial distribution patterns of leaf area index (LAI) in broadleaved-Korean pine forests and explore the application value of the stratified Voronoi diagram method in simulating the spatial distribution of LAI in multi-storey forest ecosystems.【Method】The study focused on the virgin broadleaved-Korean pine forest located on the downhill side of the core zone of Liangshui National Nature Reserve. The trees within the forest stand that reached the minimum diameter at breast height (5 cm) were divided into five height classes (Class Ⅰ, H < 10 m; Class Ⅱ, 10 m ≤ H < 15 m; Class Ⅲ, 15 m ≤ H < 20 m; Class Ⅳ, 20 m ≤ H < 25 m; Class Ⅴ, H ≥ 25 m).The Voronoi diagram method was used to simulate the spatial distribution of LAI in different height classes within the forest. The results were combined to form an overall spatial distribution of LAI for the forest stand. Furthermore, the overall characteristics of LAI at the forest stand scale were analyzed, including the vertical distribution patterns of LAI for different tree species and the entire forest stand. The short-range horizontal spatial autocorrelation patterns of LAI at different height classes and the overall forest stand were analyzed using the spatial semivariance function and incremental spatial autocorrelation method. 【Result】Three results were obtained. First, the overall LAI of the study plot was 10.807, with Pinus koraiensis, Acer momo, Betula platyphylla, Tilia amurensis and Fraxinus mandshurica making the top five contributions to the stand LAI. The local LAI in the understorey varied within the range of 0-75, with 48.7% of the understorey having a LAI of 0. The probability density histogram of the LAI in the area with canopy cover had a single-peak distribution, with the peak between 15-25. Second, the LAI of broadleaved-Korean pine forest was 0.420, 2.420, 2.210, 2.707 and 3.050 from height class I to height class V respectively, with vertical distribution tendency degree of total LAI in the stand being 1.171 and the coefficient of variation of total LAI in different height classes being 47.3%. From height class Ⅰ to Ⅴ, the number of canopy patches was 53, 39, 12, 11, and 8 respectively. The LAI under the canopy patches of each species showed an increasing trend as the height level increased. Third, the Nugget value, Sill value, range and Nugget/Sill ratio of the spatial semi-variance function of LAI in broadleaved Korean pine forest were 4.770, 164.010, 5.108 m and 0.029, respectively. The LAI was similarly clustered at lag distances less than 27.0 m and greater than 38.5 m, and spatially random at lag distances between 27 m and 38.5 m (P<0.05). As the lag distance gradually increased, the Z-score of the LAI showed two peaks at 14 and 24 m.【Conclusion】The LAI of broadleaved-Korean pine forests in gentle slope positions exhibits distinct vertical stratification. The leaf area of different tree species tends to be distributed at different heights. For instance, Pinus koraiensis, Picea asperata, and Fraxinus mandshurica, as tall arbor species, have their leaf area concentrated in the upper canopy. On the other hand, Acer opalus and Ulmus, representing middle-sized and small-sized arbor species, have their leaf area concentrated in the lower canopy. The LAI of broadleaved-Korean pine forests in lower gentle slope positions exhibits strong short-range spatial autocorrelation in the horizontal direction. The horizontal spatial distribution of LAI within the forest stand was similarly clustered at most research scales, which is strongly influenced by the spatial distribution of trees.
 PDF(2261 KB)


 PDF(2261 KB)
 PDF(2261 KB)
