影响中国刺柏属8种地理分布格局的主导因子

王爱君, 路东晔, 贺嵘, 黄海广, 宁静, 韩若霜, 张国盛, 贺玉娇

南京林业大学学报(自然科学版) ›› 2025, Vol. 49 ›› Issue (6) : 205-214.

PDF(3705 KB)
PDF(3705 KB)
南京林业大学学报(自然科学版) ›› 2025, Vol. 49 ›› Issue (6) : 205-214. DOI: 10.12302/j.issn.1000-2006.202404037
研究论文

影响中国刺柏属8种地理分布格局的主导因子

作者信息 +

Dominant factors influencing the geographical distribution pattern of eight species of Juniperus in China

Author information +
文章历史 +

摘要

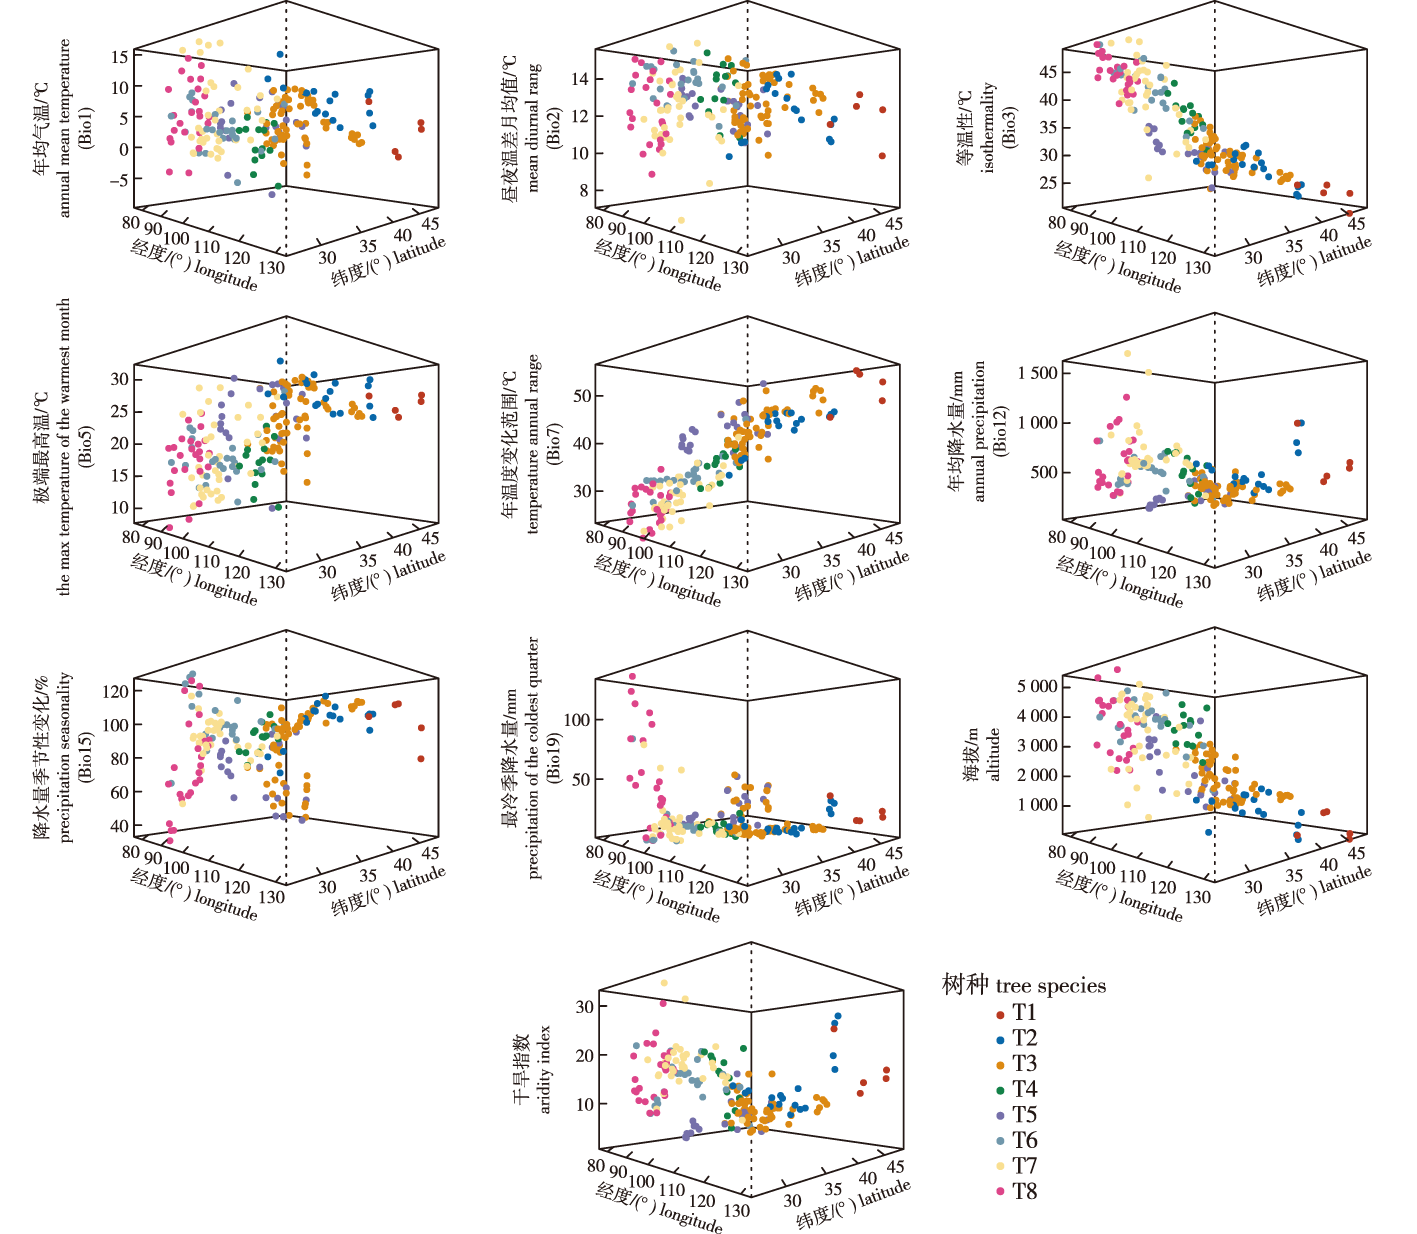
【目的】树种的地理分布特征反映了气候趋势,同时气候变化也反作用于树种分布,它们之间的相互关系可为研究树种地理分布和起源,制定保护策略提供理论依据。【方法】以位于3级地理阶梯天然分布的刺柏属(Juniperus)8种为研究对象,通过对222个样点的气候、海拔数据进行方差、变异系数分析,以及线性回归、主成分与线性判别分析,比较和确定限制刺柏树种地理分布格局形成的主导因子。【结果】年均气温、昼夜温差月均值、等温性、极端最高温、年温度变化范围、年均降水量、降水量季节性变化、最冷季降水量、海拔、干旱指数在8种分布区间存在显著差异(P<0.001);其中等温性、年温度变化范围、年均降水量、海拔、干旱指数的方差来自树种间,剩余5个因子的方差主要来自树种内。昼夜温差月均值、等温性、极端最高温、年温度变化范围、降水量季节性变化的变异系数在20%左右,限制性强。经纬度与等温性、极端最高温、年温度变化范围、降水量季节性变化、海拔显著相关,其中与等温性、海拔因子为负相关。年温度变化范围、等温性、降水量季节性变化、极端最高温、海拔是驱动刺柏属8种地理分布差异的主要因子,并且温度载荷大于降水量。8种分布格局大致分为兴安圆柏(J. sabina var. davurica)、杜松(J. rigida)、叉子圆柏(J. sabina)、新疆方枝柏(J. pseudosabina)分布于干冷区,祁连圆柏(J. przewalskii)、大果圆柏(J. tibetica)、方枝柏(J. saltuaria)、滇藏方枝柏(J. indica)分布于暖湿区。【结论】温度(等温性、极端最高温、年温度变化范围)、水分(降水量季节性变化)和海拔共同作用驱动着刺柏属8种的地理分布,并且温度影响大于水分影响,海拔因子重新调整了相同经纬度地区的水热状况。本研究表明刺柏属树种喜生于冷湿环境,体现出其泛北极植物区系的特征;提出了刺柏属8种适宜分布区的温度、水分和海拔高度的均值与范围,可为今后异地栽种提供理论参考。

Abstract

【Objective】The geographical distribution characteristics of tree species reflect climate trends, while climate change in turn influences their distribution. The interaction between these provides a theoretical basis for studying the geographical distribution and origin of tree species, as well as formulating conservation strategies.【Method】Taking eight naturally distributed species of the Juniperus across the three-level geographical terrains as the research subjects, this study employed analysis of variance (ANOVA), coefficient of variation, linear regression analysis, principal component analysis (PCA), and linear discriminant analysis (LDA) on climate and altitude data from 222 sampling sites. The aim was to compare and identify the dominant factors restricting the formation of the geographical distribution pattern of Juniperus species.【Result】Significant differences (P<0.001) were observed among the eight species in terms of annual mean temperature, mean diurnal range, isothermality, the max temperature of the warmest month, temperature annual range, annual precipitation, precipitation seasonality, precipitation of the coldest quarter, altitude, and aridity index. Among these factors, the variance in isothermality, temperature annual range, annual precipitation, altitude, and aridity index originated primarily from interspecific differences, while the variance in the remaining five factors originated mainly from intraspecific variations. The coefficients of variation for mean diurnal range, isothermality, the max temperature of the warmest month, temperature annual range, and precipitation seasonality were approximately 20%, indicating strong restrictive effects. Latitude and longitude were significantly correlated with isothermality, the max temperature of the warmest month, temperature annual range, precipitation seasonality and altitude, with negative correlations observed for isothermality and altitude.The temperature annual range, isothermality, precipitation seasonality, the max temperature of the warmest month, and altitude were the main drivers of geographical distribution differences among the eight Juniperus species, and the contribution of temperature-related factors exceeded that of precipitation-related ones. The eight species were roughly divided into two groups: the dry-cold zone group, including J. sabina var. davurica, J. rigida, J. sabina and J. pseudosabina; and the warm-humid zone group, including J. przewalskii, J. tibetica, J. saltuaria and J. indica.【Conclusion】Temperature (isothermality, the max temperature of the warmest month, temperature annual range), moisture (precipitation seasonality), and altitude collectively drive the geographical distribution of each Juniperus species, with temperature exerting a greater influence than moisture. Altitude readjusts the hydrothermal conditions in areas with the same latitude and longitude. This study presents the mean values and ranges of temperature, moisture, and altitude for the suitable distribution areas of the eight species, providing a theoretical reference for future ex-situ cultivation.The findings indicate that Juniperus species prefer cold and humid environments, reflecting their characteristics as part of the Holarctic flora.

关键词

刺柏属 / 地理分布格局 / 主导因子 / 气候 / 海拔

Key words

Juniperus / geographical distribution pattern / dominant factor / climate / altitude

引用本文

导出引用
王爱君, 路东晔, 贺嵘, . 影响中国刺柏属8种地理分布格局的主导因子[J]. 南京林业大学学报(自然科学版). 2025, 49(6): 205-214 https://doi.org/10.12302/j.issn.1000-2006.202404037
WANG Aijun, LU Dongye, HE Rong, et al. Dominant factors influencing the geographical distribution pattern of eight species of Juniperus in China[J]. Journal of Nanjing Forestry University (Natural Sciences Edition). 2025, 49(6): 205-214 https://doi.org/10.12302/j.issn.1000-2006.202404037
中图分类号: S79   

参考文献

[1]
FARJON A. A monograph of Cupressaceae and Sciadopitys[J]. Biology, Environmental Science, 2000:83002581.
[2]
ADAMS R P. Junipers of the world: the genus Juniperus[M]. 2nd ed. Vancouver, Canada: Trafford Publishing, 2010.DOI: 10.2179/0008-7475-75.2.258.
[3]
THORNE R F. Major disjunctions in the geographic ranges of seed plants[J]. The Quarterly Review of Biology, 1972, 47(4):365-411.DOI: 10.2307/2820737.
[4]
ADAMS R P. Junipers of the world : the genus Juniperus[M]. Vancouver, Canada: Trafford Publishing, 2004.
[5]
毛康珊. 广义柏科的生物地理学研究:从板块漂移理论到冰期避难所[D]. 兰州: 兰州大学, 2010.
MAO K S. Biogeographic study of Cupressaceae in a broad sense:from plate drift theory to ice age refuge[D]. Lanzhou: Lanzhou University, 2010.
[6]
WIENS J J. Speciation and ecology revisited: phylogenetic niche conservatism and the origin of species[J]. Evolution, 2004, 58(1):193-197.DOI:10.1111/j.0014-3820.2004.tb01586.x.
[7]
FANG J Y, LECHOWICZ M J. Climatic limits for the present distribution of beech (Fagus L.) species in the world[J]. Journal of Biogeography, 2006, 33(10):1804-1819.DOI:10.1111/j.1365-2699.2006.01533.x.
[8]
WANG G H, LI H, ZHAO H W, et al. Detecting climatically driven phylogenetic and morphological divergence among spruce (Picea) species worldwide[J]. Biogeosciences, 2017, 14(9):2307-2319.DOI:10.5194/bg-14-2307-2017.
. This study aimed to elucidate the relationship between climate and the phylogenetic and morphological divergence of spruces (Picea) worldwide. Climatic and georeferenced data were collected from a total of 3388 sites distributed within the global domain of spruce species. A phylogenetic tree and a morphological tree for the global spruces were reconstructed based on DNA sequences and morphological characteristics. Spatial evolutionary and ecological vicariance analysis (SEEVA) was used to detect the ecological divergence among spruces. A divergence index (D) with (0, 1) scaling was calculated for each climatic factor at each node for both trees. The annual mean values, extreme values and annual range of the climatic variables were among the major determinants for spruce divergence. The ecological divergence was significant (P &lt; 0. 001) for 185 of the 279 comparisons at 31 nodes in the phylogenetic tree, as well as for 196 of the 288 comparisons at 32 nodes in the morphological tree. Temperature parameters and precipitation parameters tended to be the main driving factors for the primary divergences of spruce phylogeny and morphology, respectively. Generally, the maximum D of the climatic variables was smaller in the basal nodes than in the remaining nodes. Notably, the primary divergence of morphology and phylogeny among the investigated spruces tended to be driven by different selective pressures. Given the climate scenario of severe and widespread drought over land areas in the next 30–90 years, our findings shed light on the prediction of spruce distribution under future climate change.
[9]
中国植被编辑委员会. 中国植被[M]. 北京: 科学出版社,1980.
Chinese Vegetation Editorial Committee. Chinese vegetation[M]. Beijing: Science Press,1980.
[10]
李文华, 周沛村. 暗针叶林在欧亚大陆分布的基本规律及其数学模型的研究[J]. 资源科学, 1979, 1(1):21-34.
摘要
LI W H, ZHOU P C. Study on the basic law and mathematical model of dark coniferous forest distribution in Eurasia[J]. Resources Science, 1979, 1(1):21-34.
[11]
王思齐, 朱章明. 中国蔷薇属植物物种丰富度分布格局及其与环境因子的关系[J]. 生态学报, 2022, 42(1):209-219.
WANG S Q, ZHU Z M. Relationships between species richness patterns of Rosa L.and environmental factors in China[J]. Acta Ecologica Sinica, 2022, 42(1):209-219.DOI:10.5846/stxb202002280363.
[12]
ZHANG Y, KONG Z C, YAN S, et al. Fluctuation of Picea timber-line and paleo-environment on the northern slope of Tianshan Mountains during the late Holocene[J]. Chinese Science Bulletin, 2006, 51(14):1747-1756.DOI:10.1007/s11434-006-2029-9.
[13]
王静. 川渝地区马先蒿属物种多样性及其与环境因子的关系[D]. 成都: 四川大学, 2005.
WANG J. Species diversity of Pedicularis in Sichuan and Chongqing and its relationship with environmental factors[D]. Chengdu: Sichuan University, 2005.
[14]
孟和, 姜真杰, 张国盛. 内蒙古臭柏不同分布区生长与生态因子的关联分析[J]. 浙江农林大学学报, 2010, 27(1):51-56.
MENG H, JIANG Z J, ZHANG G S. Using the Grey System Theory for analysis of relationship between Sabina vulgaris growth and ecological factors[J]. Journal of Zhejiang A & F University, 2010, 27(1):51-56.DOI: 10.3969/j.issn.2095-0756.2010.01.008.
[15]
ADAMS R P, BORATYNSKI A, MATARACI T, et al. Discovery of Juniperus sabina var. balkanensis R.P.Adams and A.N.Tashev in southwestern Turkey[J]. Phytologia, 2017, 99(1):22-31.
[16]
ADAMS R P, BORATYNSKI A, MARCYSIAK K, et al. Discovery of Juniperus sabina var. balkanensis R.P.Adams and A.N.Tashev in Macedonia,Bosnia-Herzegovina,Croatia and Central and Southern Italy and relictual polymorphisms found in nrDNA[J]. Phytologia, 2018, 100(2):117-127.
[17]
QUAN C, HAN S, UTESCHER T, et al. Validation of temperature-precipitation based aridity index: paleoclimatic implications[J]. Palaeogeography Palaeoclimatology Palaeoecology, 2013, 386:86-95.DOI:10.1016/j.palaeo.2013.05.008.
[18]
FANG J Y, YODA K. Climate and vegetation in China V: effect of climatic factors on the upper limit of distribution of evergreen broadleaf forest[J]. Ecological Research, 1991, 6(1):113-125.DOI:10.1007/BF02353874.
[19]
李贺, 张维康, 王国宏. 中国云杉林的地理分布与气候因子间的关系[J]. 植物生态学报, 2012, 36(5):372-381.
摘要
为了揭示中国云杉林的地理分布与气候因子间的关系, 在中国云杉林15个群系的地理分布范围内选取613个地理坐标点, 其中包括云杉各个种分布的海拔上限和下限坐标点各235和228个。通过数字地球系统确定每个点的海拔高程, 从中国气象插值数据库获取每个点的气候数据。数据分析分别采用线性回归、变异系数比较和主成分分析(PCA)法。结果显示, 中国云杉林分布范围内, 年平均气温、最冷月平均气温、最热月平均气温、&ge;5 ℃积温、&ge;0 ℃积温、年降水量、土壤水分含量和干燥指数&alpha;的平均值分别是3.38 ℃、&ndash;9.75 ℃、14.78 ℃、1 227.83 ℃&middot;d、2 271.19 ℃&middot;d、712.23 mm、80.02%和0.50; 各气候因子与中国云杉林垂直分布的上下限间均具有显著的回归关系; 除了年平均气温和最冷月平均气温变异系数较大外, 其他6个气候因子的变异系数均较小, 且彼此间无显著差异; 无论是云杉分布的上限还是下限, &ge;5 ℃积温和&ge;0 ℃积温在PCA第一主分量具有较高的载荷, 而年降水量和土壤水分含量在第二、三主分量具有较高的载荷。影响中国云杉林分布的主要气候因子是生长季节积温, 其次是年降水量和土壤水分含量。
LI H, ZHANG W K, WANG G H. Relationship between climatic factors and geographical distribution of Spruce forests in China[J]. Chinese Journal of Plant Ecology, 2012, 36(5):372-381.DOI:10.3724/SP.J.1258.2012.00372.
<p><em>Aims</em> Our objective was to examine the relationship between climatic factors and geographical distribution of spruce forests in China.</br><em>Methods</em> We sampled 613 points within the geographical range of Chinese spruce forests, of which 235 points were at the upper altitudinal limit and 228 at the lower altitudinal limit. The elevation for each point was determined using Google Earth while climatic data were from the Chinese meteorological interpolation database. Linear regression, comparison of coefficient of variation (<em>CV)</em> and principal component analysis (PCA) were conducted for data analysis.</br><em>Important findings</em> Within the distribution range of Chinese spruce forests, mean values of mean annual air temperature (<em>MAT</em>), mean air temperature of the coldest month (<em>MTCM</em>), mean air temperature of the warmest month (<em>MTWM</em>), growing degree days on a 5 ℃ basis (<em>GDD<sub>5</sub></em>) and on a 0 ℃ basis (<em>GDD<sub>0</sub></em>), mean annual precipitation (<em>MAP</em>), soil moisture (<em>SM</em>) and aridity index (<em>&alpha;</em>) are 3.38 ℃, &ndash;9.75 ℃, 14.78 ℃, 1 227.83 ℃&middot;d, 2 271.19 ℃&middot;d, 712.23 mm, 80.02% and 0.50, respectively. Both the upper and lower limits of altitude were significantly correlated with each of the climatic factors. In terms of <em>CV</em>, <em>MAT</em> and <em>MTCM</em> are significantly higher than the other six climatic factors; however, no significant differences were detected among those six. In addition, <em>GDD<sub>5</sub></em> and <em>GDD<sub>0</sub></em> have higher loading on the first principal component, yet <em>MAP</em> and <em>SM</em> have higher loading on the second and third principal component. Major conclusions are that <em>GDD<sub>0</sub></em> and <em>GDD<sub>5</sub></em> are likely the key factors that influence the distribution of Chinese spruce forest, followed by <em>MAP</em> and <em>SM</em>.</p>
[20]
邱明宇, 王飞, 南芳茹, 等. 中国串珠藻科植物地理分布及与环境因子的关系[J]. 水生生物学报, 2021, 45(2):455-463.
QIU M Y, WANG F, NAN F R, et al. Geographical distribution and relationship with environmental factors of Batrachospermaceae in China[J]. Acta Hydrobiologica Sinica, 2021, 45(2):455-463.DOI:10.7541/2021.2020.005.
[21]
KAISER K, MICHE G, SCHOCH W H, et al. Relief, soil and lost forests: late holocene environmental changes in southern Tibet under human impact[J]. Zeitschrift Fur Geomorphologie Supplement, 2006, 142(142):149-173.DOI:0044-2798/06/0142-0149.
[22]
KAISER K, SCHOCH W H, MIEHE G. Holocene paleosols and colluvial sediments in northeast Tibet (Qinghai Province,China):properties,dating and paleoenvironmental implications[J]. Catena, 2007, 69(2):91-102.DOI:10.1016/j.catena.2006.04.028.
[23]
KAISER K, OPGENOORTH L, SCHOCH W H, et al. Charcoal and fossil wood from Palaeosols,sediments and artificial structures indicating Late Holocene woodland decline in southern Tibet (China)[J]. Quaternary science reviews 2009, 28(15-16):1539-1554.DOI:10.1016/j.quascirev.2009.02.016.
[24]
MIEHE G, MIEHE S, SCHLÜTZ F, et al. Palaeoecological and experimental evidence of former forests and woodlands in the treeless desert pastures of southern Tibet (Lhasa,A.R.Xizang, China)[J]. Palaeogeogr Palaeoclimatol Palaeoecol, 2006, 242(1/2):54-67.DOI:10.1016/j.palaeo.2006.05.010.
[25]
MIEHE G, MIEHE S, WILL M, et al. An inventory of forest relicts in the pastures of southern Tibet (Xizang A.R.,China)[J]. Plant Ecol, 2008, 194(2):157-177.DOI:10.1007/s11258-007-9282-0.
[26]
MILNE R I, ABBOTT R J. The origin and evolution of tertiary relict floras[J]. Advances in Botanical Research,2002:38:281-314.DOI: 10.1016/S0065-2296(02)38033-9.
[27]
张晓玮, 王婧如, 王明浩, 等. 中国云杉属树种地理分布格局的主导气候因子[J]. 林业科学, 2020, 56(4):1-11.
ZHANG X W, WANG J R, WANG M H, et al. Dominant climatic factors influencing the geographical distribution pattern of Picea in China[J]. Scientia Silvae Sinicae, 2020, 56(4):1-11.DOI:10.11707/j.1001-7488.20200401.
[28]
WANG M H, WANG J R, ZHANG A P, et al. Functional traits related to environmental divergence in combination with phylogenetic relationship of Picea species[J]. Dendrobiology, 2019, 80:131-142.DOI:10.12657/denbio.080.013.
[29]
李晓笑, 陶翠, 王清春, 等. 中国亚热带地区4种极危冷杉属植物的地理分布特征及其与气候的关系[J]. 植物生态学报, 2012, 36(11):1154-1164.
LI X X, TAO C, WANG Q C, et al. Characteristics of geographic distribution of four critically endangered species of Abies in subtropical China and its relationship with climate[J]. Chinese Journal of Plant Ecology, 2012, 36(11):1154-1164.DOI:10.3724/SP.J.1258.2012.01154.
[30]
刘然, 王春晶, 何健, 等. 气候变化背景下中国冷杉属植物地理分布模拟分析[J]. 植物研究, 2018, 38(1):37-46.
摘要
中国是世界上冷杉属(Abies Mill.)植物种类最为丰富、分布地域最广的国家,也是研究冷杉属植物分布成因与规律的关键地区。本文通过中国数字植物标本馆、全球生物多样性信息数据库和相关文献三种途径收集我国冷杉属植物的地理分布数据,结合当前和未来气候情景,应用最大熵模型(MaxEnt)模拟冷杉属植物的潜在分布,并使用GIS的空间分析功能做生境适宜性分析,评估我国各地区对冷杉属植物的保护能力。结果显示:(1)四川西南部、云南北部、西藏自治区东南部是我国冷杉属植物分布的热点地区;(2)在未来气候变化情景下,我国冷杉属植物的适宜生境面积将明显减少;(3)适宜生境在未来有向北迁移的趋势;(4)就各地区保护能力而言,在当前气候情景下,云南省的保护能力最高,在未来,我国西部地区的保护能力呈上升趋势,中部和东部地区呈下降趋势。本研究可为冷杉属植物的保护工作提供一定的理论依据和参考价值。
LIU R, WANG C J, HE J, et al. Analysis of geographical distribution of Abies in China under climate change[J]. Bulletin of Botanical Research, 2018, 38(1):37-46.DOI: 10.7525/j.issn.1673-5102.2018.01.005.
China is the country which has the most abundant and the widest geographical distribution of <em>Abies</em> Mill. species in the world. It is also the key area for studying the causes and law of <em>Abies</em> distribution. We collected the data of geographical distribution of <em>Abies</em> in China in three ways: Chinese Virtual Herbarium, Global Biodiversity Information Facility and relevant literatures. Based on the current and future climate scenarios, the maximum entropy model(MaxEnt) was used to simulate the potential distribution of <em>Abies</em>. Also, we analysed of habitat suitability and evaluated the protective capability of various regions in China, using GIS spatial analysis functions. The results showed that: (1)Southwestern Sichuan, northern Yunnan, as well as southeastern Tibet are the hot spots for <em>Abies</em> in China; (2)The area of suitable habitat of <em>Abies</em> in China will significantly reduce under the future climate change scenario; (3)The suitable habitat has the tendency of moving northwards in the future; (4)Yunnan province has the highest protective capability under the current climate scenario. Under the future climate change scenario, the protective capability of the western regions in China will increase, while that of the central and eastern regions will decline. This study can provide a theoretical basis and reference value for the protection of <em>Abies</em>.
[31]
徐振朋, 张佳琦, 宛涛, 等. 孑遗植物裸果木历史分布格局模拟及避难区研究[J]. 西北植物学报, 2017, 37(10):2074-2081.
XU Z P, ZHANG J Q, WAN T, et al. Study on the history distribution pattern of Gymnocarpos przewalskii and refuge area[J]. Acta Botanica Boreali-Occidentalia Sinica, 2017, 37(10):2074-2081.DOI: 10.7606/j.issn.1000-4025.2017.10.2074.
[32]
SHERWOOD A R, VIS M L, SHEATH R G. Phenology and phylogenetic positioning of the Hawaiian endemic freshwater Alga,Batrachospermum spermatiophorum(Rhodophyta,Batrachospermales)[J]. Phycological Research, 2010, 52(3):193-203. DOI:10.1111/j.1440-183.2004.00343.x.
[33]
WANG J R, HAWKINS C D B, LETCHFORD T. Photosynthesis,water and nitrogen use efficiencies of four paper birch (Betula papyrifera) populations grown under different soil moisture and nutrient regimes[J]. Forest Ecol Manage, 1998, 112(3):233-244.DOI:10.1016/S0378-1127(98)00407-1.

基金

国家自然科学基金项目(31460204)

编辑: 吴祝华
PDF(3705 KB)

Accesses

Citation

Detail

段落导航
相关文章

/