 PDF(23052 KB)
 PDF(23052 KB)
 PDF(23052 KB)
白洋淀湿地近30年景观格局演变研究
Study on the evolution of landscape pattern of Baiyangdian wetland in the last 30 years
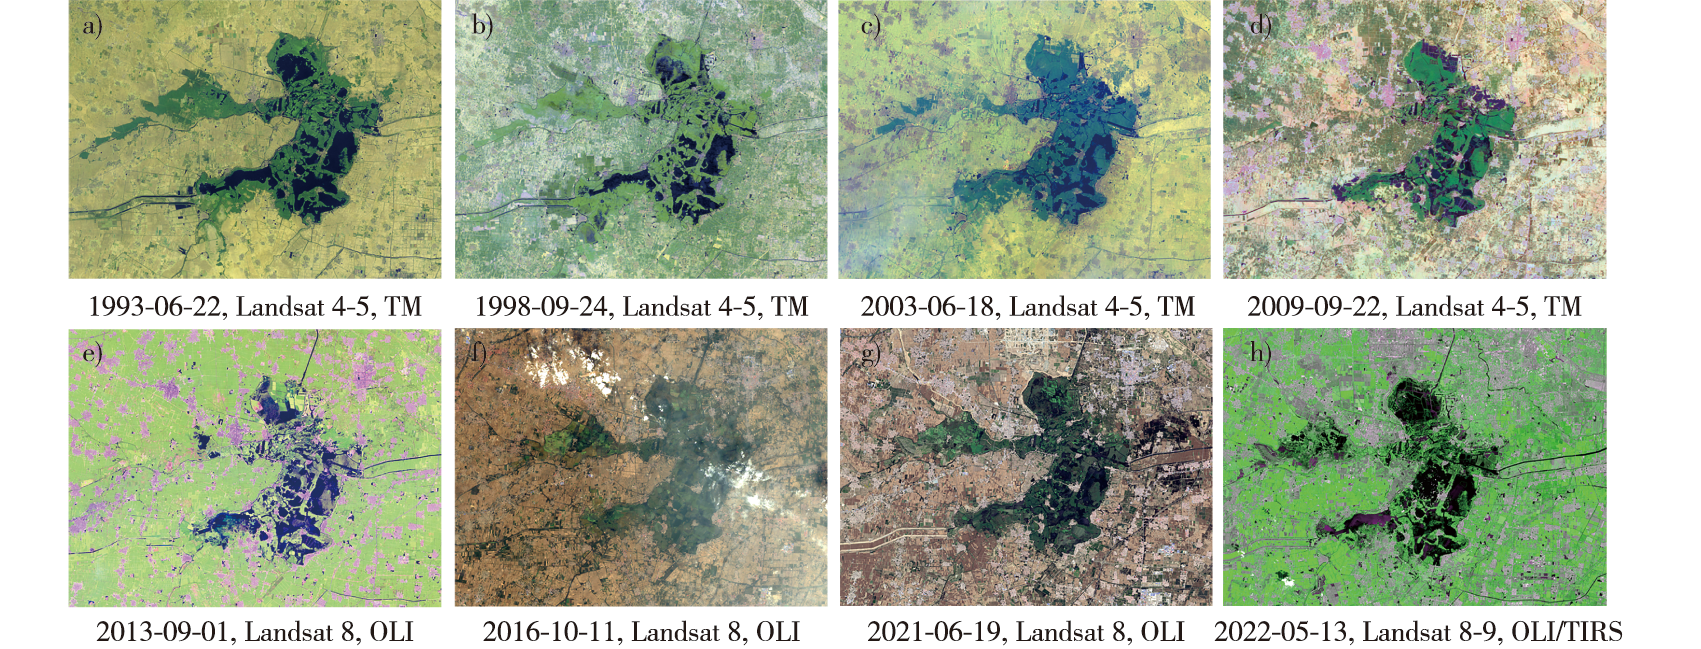
【目的】 白洋淀湿地是海河流域断流河道恢复与再利用模式研究的重点对象,明晰其景观格局演变规律,可为我国同类型湿地的生态环境修复与再利用提供理论支持。【方法】以白洋淀湿地为研究对象,利用地理空间数据平台获取的1993—2022年共8期遥感影像,基于交叉学科视角,运用景观生态学的形态学空间格局分析(MSPA)方法识别核心生态源地,并分析白洋淀湿地景观格局演变特征及驱动因素。【结果】①耕地和水体是白洋淀湿地内两类持续占主导地位的景观类型,两者总面积约占湿地总面积的90%。景观变化主要集中在1993—2003年,这10年间湿地整体空间完整性明显下降,破碎化程度加剧,林地和湿地水体面积共减少58.78 km2,主要转为耕地和建设用地。②景观格局演变呈现阶段性特征:1993—1998年,湿地处于相对稳定阶段,斑块分布较均匀,但西南部部分斑块向中心区收缩;2003—2009年,系统进入动荡期,破碎化程度和边缘效应增强;2013—2022年,景观进入发展期,核心区斑块数量增多,至2022年核心区面积显著扩大,生态源地质量总体改善。③MSPA结果表明,2013—2022年间核心生态源地面积稳步增加,预示未来景观发展呈向好趋势。④ 相关性分析显示,景观格局演变与社会经济因素(如地区生产总值、总人口、第三产业产值)显著相关,而与气温、相对湿度、降水量、日照时数等自然驱动因子无明显关系。【结论】①1993—2003年间,白洋淀耕地面积增加54.31 km2,林地和草地面积减少;2003—2021年间,耕地逐步转为草地、水体和建设用地;2003年后耕地面积持续减少,主要发生在湿地北部和西南部区域。②2003年前高强度的人类活动导致景观斑块破碎化加剧、空间密度降低;此后通过人工调控,景观结构趋于多样与均衡。从未来趋势看,核心生态源地面积预计将持续增加,适宜生态物种栖息的生境数量也将增长。③ MSPA结果进一步表明,核心斑块的数量与面积均呈扩大态势,核心区最大面积记录为1993年的56.60 km2;2003—2022年间,白洋淀湿地内部生态网络重焕活力,生境面积扩大,生态源地质量提升。④在驱动因素中,社会经济因素(尤其是安新县地区生产总值、总人口和第三产业产值)与景观格局演变显著相关,是景观变化的主要决定因素;自然驱动因素影响不显著。未来应加强白洋淀湿地核心区保护,重点增加核心区面积,控制耕地规模并防止耕地面积过度侵占生态源地,维护景观结构异质性和生物多样性,促进景观格局的可持续发展。
【Objective】 The Baiyangdian wetland, located within the Xiong’an New Area of China, is a principal component of the Daqing River system, a major branch of the Haihe River basin. In recent years, the restoration and reutilization of disconnected river courses in the Haihe basin—an ecological lifeline for the Beijing-Tianjin-Hebei region—have become critical research topics for Chinese scholars. Baiyangdian is not only the largest freshwater wetland in the Daqing River system but also a vital ecological source within the regional ecosystem, serving as a key node for material cycling and energy exchange. Clarifying the spatial distribution and evolutionary of Baiyangdian’s landscape patterns provides essential theoretical support for future ecological restoration and resource reutilization strategies in similar river-basin wetlands across China. 【Method】Taking Baiyangdian wetland as the research subject, this study utilized eight periods of remote sensing imagery from 1993 to 2022, obtained from the Geospatial Data Cloud, to classify landscape types. Nine landscape pattern indices were calculated at both the landscape and type levels to evaluate landscape dominance. The morphological spatial pattern analysis (MSPA), a landscape ecology methodology, was applied to identify ecological source areas in the wetland core zone. Correlation analyses were then conducted between landscape indices and both social and natural driving factors to reveal the evolutionary and determinants of landscape pattern change. On this basis, the likely future trajectory of Baiyangdian’s landscape evolution was predicted. 【Result】(1) Cropland and water bodies were consistently identified as the two dominant landscape types in the Baiyangdian Wetland, together occupying approximately 90% of the total wetland area. Landscape changes were concentrated in the decade between 1993 and 2003, when overall spatial integrity markedly declined and fragmentation intensified. Forest and water body areas jointly decreased by 58.78 km2, primarily converted into cropland and built-up land.(2) The evolution of landscape patterns exhibited distinct stages. Between 1993 and 1998, the wetland remained in a relatively stable phase, with evenly distributed patches, although some southwestern patches shrank toward the central area. From 2003 to 2009, the system entered a turbulent phase characterized by markedly increased fragmentation and edge effects. Between 2013 and 2022, the landscape entered a developmental phase, with a growing number of core-zone patches, significant expansion of the core area by 2022, and an overall improvement in ecological source quality.(3) MSPA results confirmed that the area of core ecological sources increased steadily between 2013 and 2022, indicating a positive trend in future landscape development.(4) Correlation analysis revealed that landscape pattern evolution was significantly associated with socioeconomic factors, including gross domestic product (GDP), total population, and the output of the tertiary industry, while no significant relationships were observed with natural drivers such as temperature, relative humidity, precipitation, or sunshine duration. 【Conclusion】(1) Between 1993 and 2003, cropland area in Baiyangdian increased by 54.31 km2, while forest and grassland declined. From 2003 to 2021, cropland was gradually converted into grassland, water bodies, and built-up land. Following the promulgation of land-use policies by the State Council in 2003, cropland areas steadily decreased, primarily in the northern and southwestern parts of the wetland. (2) Prior to 2003, intense human activity had heightened fragmentation and reduced spatial density of landscape patches. Subsequently, through artificial regulation and policy reforms, the structure of the landscape became more diverse and balanced. From the perspective of future trends, the area of core ecological sources is expected to continue increasing, accompanied by growth in the number of suitable habitats for ecological species. (3) MSPA results further demonstrated that both the number and area of core patches were expanding. The maximum recorded extent of the core zone was 56.60 km2 in 1993. Between 2003 and 2022, the ecological network within Baiyangdian Wetland regained vitality, with enlarged habitat areas and improved ecological source quality.(4) Among driving forces, socioeconomic factors—particularly Anxin County’s GDP, total population, and tertiary industry output—were significantly correlated with landscape pattern evolution, making them the primary determinants of change. By contrast, natural drivers showed no significant effects. On the basis of these findings, it is imperative to continue strengthening the protection of core ecological source areas and to consistently implement ecological governance measures. Such actions are essential to the sustainable development of Baiyangdian Wetland.
白洋淀湿地 / 景观格局演变 / MSPA分析法 / 驱动因素 / 湿地生态 / 生物多样性保护
Baiyangdian wetland / landscape pattern evolution / MSPA analysis / drivering factors / wetland ecology / biodiversity conservation
| [1] |
王瑞卿, 张明祥, 武海涛, 等. 从《中华人民共和国湿地保护法》解析湿地定义与分类[J]. 湿地科学, 2022, 20(3):404-412.
|
| [2] |
唐双娥. 我国湿地生态空间用途管制制度的困境与破解[J]. 清华法学, 2024, 18(4):173-191.
|
| [3] |
张明薇, 吕鸿达, 高世鑫, 等. 基于景观格局的扎龙国家级自然保护区湿地保护成效评估[J]. 自然保护地, 2023, 3(3):67-76.
|
| [4] |
王佳, 于莉莉, 耿林, 等. 大沽河流域滨海湿地景观格局变化及其驱动机制[J]. 海洋地质前沿, 2023, 39(8):29-37.
|
| [5] |
鲁宏旺, 胡文敏, 佘济云, 等. 生态退杨对洞庭湖湿地景观格局变化影响研究[J]. 南京林业大学学报(自然科学版), 2020, 44(3):171-178.
|
| [6] |
宋小梅, 常晓丽, 丁辰. 近30年根河流域湿地景观格局变化及驱动因素分析[J]. 水土保持学报, 2024, 38(2):294-303.
|
| [7] |
赵志强, 许晓龙, 袁青, 等. 哈尔滨段松花江湿地景观格局演变及驱动因素分析[J]. 南京林业大学学报(自然科学版), 2024, 48(2):219-226.
|
| [8] |
贾艳艳, 唐晓岚, 唐芳林, 等. 1995—2015年长江中下游流域景观格局时空演变[J]. 南京林业大学学报(自然科学版), 2020, 44(3):185-194.
|
| [9] |
陈雁飞, 汤臣栋, 马强, 等. 崇明东滩自然保护区景观格局动态分析[J]. 南京林业大学学报(自然科学版), 2017, 41(1):1-8.
|
| [10] |
任琼, 佟光臣, 张金池. 鄱阳湖区域景观格局动态变化研究[J]. 南京林业大学学报(自然科学版), 2016, 40(3):94-100.
|
| [11] |
张佳敏, 刘小燕, 邓懿, 等. 无锡市小微湿地演变特征及影响因素分析[J]. 南京林业大学学报(自然科学版), 2024, 48(2):27-36.
|
| [12] |
尹小岚, 谭程月, 柯樱海, 等. 1973—2020年黄河三角洲滨海盐沼湿地景观格局演化模式和驱动因素[J]. 生态学报, 2024, 44(1):67-80.
|
| [13] |
范育蕾, 夏哲一, 魏雪, 等. 四个时期长江经济带湿地生态系统服务对景观格局响应研究[J]. 湿地科学, 2024, 22(1):139-147.
|
| [14] |
闫欣, 牛振国. 1990—2017年白洋淀的时空变化特征[J]. 湿地科学, 2019, 17(4):436-444.
|
| [15] |
孟斌, 郅晓沙, 王晨, 等. 白洋淀流域河流干涸断流遥感监测[J]. 科学技术与工程, 2022, 22(9):3827-3833.
|
| [16] |
朱金峰, 周艺, 王世新, 等. 白洋淀湿地生态功能评价及分区[J]. 生态学报, 2020, 40(2):459-472.
|
| [17] |
夏慧琪, 龚家国, 王浩, 等. 白洋淀生境空间格局演变分析[J]. 水利水电技术(中英文), 2023, 54(8):134-143.
|
| [18] |
戴菲, 毕世波, 陈明, 等. 基于MSPA与混淆矩阵的绿地系统格局演化及其驱动因子研究:以伦敦为例[J]. 中国园林, 2020, 36(11):34-39.
|
| [19] |
谢于松, 王倩娜, 罗言云. 基于MSPA的市域尺度绿色基础设施评价指标体系构建及应用:以四川省主要城市为例[J]. 中国园林, 2020, 36(7):87-92.
|
| [20] |
许涛, 樊鹤翔, 周可钦, 等. 基于MSPA-MCR-CIRCUIT的山西省运城市景观生态网络构建[J]. 中国园林, 2024, 40(3):114-118.
|
| [21] |
马银, 郑敏睿, 郑新奇, 等. 基于CA-Markov和MSPA的绿色基础设施预测与时空演变分析:以京津冀城市群为例[J]. 生态学报, 2023, 43(16):6785-6797.
|
| [22] |
成文青, 陶宇, 吴未, 等. 基于MSPA-连接度-空间句法的生态保护空间及优先级识别:以苏锡常地区为例[J]. 生态学报, 2020, 40(5):1789-1798.
|
| [23] |
国家统计局农村社会经济调查司. 中国县域统计年鉴:2021-县市卷[M]. 北京: 中国统计出版社, 2022.
Department of Rural Socio-Economic Survey, National Bureau of Statistics of the People’s Republic of China. China statistical yearbook(county-level)[M]. Beijing: China Statistics Press, 2022.
|
| [24] |
陈博, 赵立宁, 董四君. 白洋淀生态环境的演变[J]. 中国科学:生命科学, 2021, 51(9):1274-1286.
|
| [25] |
尹德超, 王旭清, 王雨山, 等. 近60年来白洋淀流域河川径流演变及湿地生态响应[J]. 湖泊科学, 2022, 34(6):2122-2133.
|
| [26] |
谷岩, 陈方方. 水适应性视角下的黄泛平原历史城镇空间营建研究[J]. 室内设计与装修, 2024(11):112-113.
|
| [27] |
赵磊, 吴文智, 李健, 等. 基于游客感知价值的生态旅游景区游客忠诚形成机制研究:以西溪国家湿地公园为例[J]. 生态学报, 2018, 38(19):7135-7147.
|
| [28] |
吴健, 于元赫, 龚亚珍, 等. 湿地保护、生态旅游与农民增收:以云南拉市海湿地为例[J]. 生态学报, 2023, 43(7):2663-2675.
|
| [29] |
曾瑜皙, 钟林生, 王灵恩. 1970—2020年三江源地区景观格局演变及其对生态旅游发展的启示[J]. 资源与生态学报(英文), 2023, 14(2):230-238.
|
| [30] |
顾虹, 苏胜昔. 白洋淀湿地保护与旅游可持续发展的关系探讨[J]. 安徽农业科学, 2011, 39(6):3456-3457.
|
| [31] |
王瑾, 张玉钧, 石玲. 可持续生计目标下的生态旅游发展模式:以河北白洋淀湿地自然保护区王家寨社区为例[J]. 生态学报, 2014, 34(9):2388-2400.
|
/
| 〈 |
|
〉 |


