基于坡度分级的旺业甸林场森林蓄积量反演

高佳乐, 蒋馥根, 龙依, 陈帅, 孙华

南京林业大学学报(自然科学版) ›› 2025, Vol. 49 ›› Issue (6) : 13-25.

PDF(5119 KB)
PDF(5119 KB)
南京林业大学学报(自然科学版) ›› 2025, Vol. 49 ›› Issue (6) : 13-25. DOI: 10.12302/j.issn.1000-2006.202410006
专题报道Ⅰ: 第十四届海峡两岸森林经理研讨会专题(执行主编 李凤日 曹林)

基于坡度分级的旺业甸林场森林蓄积量反演

作者信息 +

Inversion of forest stock volume in Wangyedian Forest Farm based on slope classification

Author information +
文章历史 +

摘要

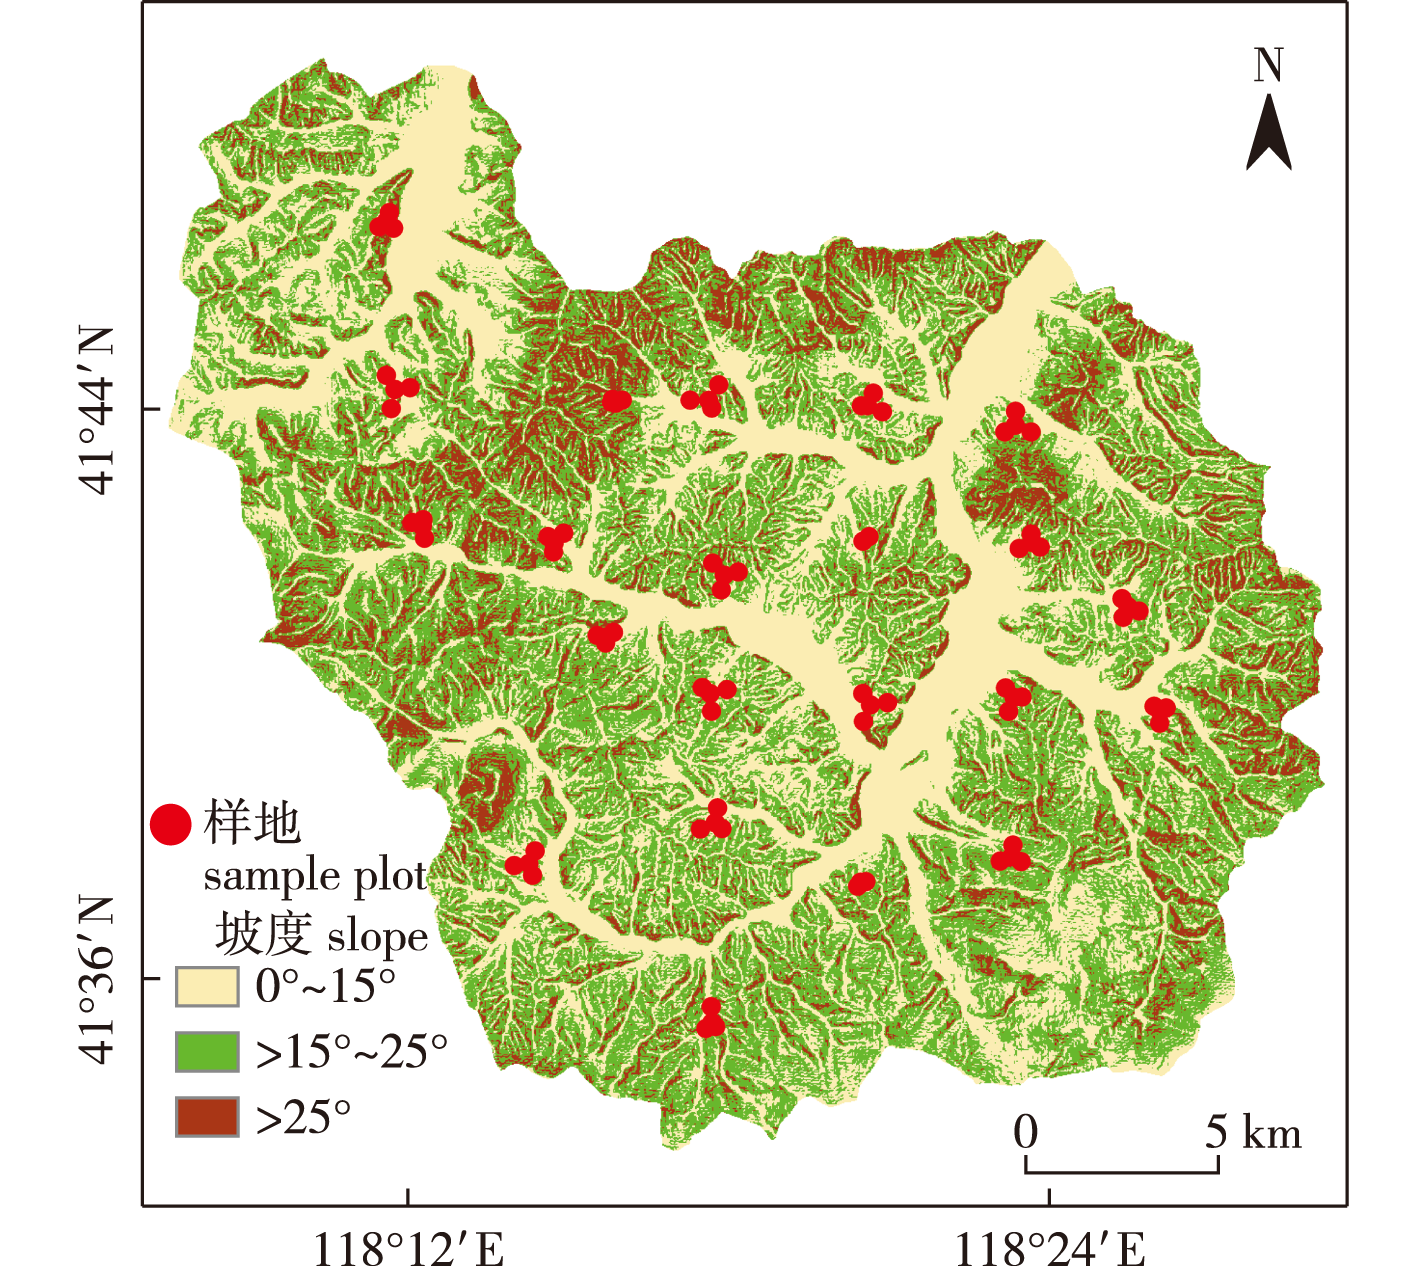
【目的】通过构建多源遥感数据集并考虑不同坡度分级的地形校正对于估测的影响,以提升森林蓄积量反演精度,为地形复杂区域的森林蓄积量遥感估算提供参考。【方法】基于Sentinel-2和GF-6遥感影像,结合旺业甸林场野外实测数据,构建多个传统非参数模型和集成学习模型对内蒙古赤峰旺业甸林场森林蓄积量进行反演。为降低地形波动对反演的影响,分别利用Teillet、VECA和SCS+C方法通过坡度分级对影像进行地形校正以提高森林蓄积量反演精度。利用Boruta法和SRF法对不同数据源特征变量进行筛选。【结果】集成学习算法的估测效果整体优于传统非参数模型,其中随机森林模型在所有模型中表现最佳。与单一数据源构建的随机森林模型相比,联合Sentinel-2和GF-6数据源后森林蓄积量反演效果有所提升,基于Boruta法的联合数据源较单一Sentinet和GF-6数据源模型均方根误差(RMSE)分别降低了7.41%和9.61%。经过基于坡度分级的地形校正后,模型RMSE降低了18.48%,森林蓄积量空间分布与旺业甸林场实际情况一致性较高。【结论】以Sentinel-2和GF-6为数据源,构建的集成学习算法可更有效地对森林蓄积量进行估测,基于坡度分级的地形校正有效提高了森林蓄积量估测精度。

Abstract

【Objective】To improve the accuracy of forest stock volume inversion and provide a reference for remote sensing estimation of forest stock volume in areas with complex terrain, this study aims to construct a multi-source remote sensing dataset and examine the impact of terrain correction at different slope classifications on the estimation results.【Method】Using Sentinel-2 and GF-6 remote sensing images, combined with field measurement data from Wangyedian Forest Farm in Chifeng, Inner Mongolia, this study constructed multiple traditional non-parametric models and ensemble learning models to invert the forest stock volume of Wangyedian Forest Farm. To reduce the influence of terrain fluctuations on inversion results, terrain corrections were performed on the images using the Teillet, VECA, and SCS+C methods at different slope classifications to improve the accuracy of forest stock volume inversion.【Result】The estimation performance of ensemble learning algorithms was generally superior to that of traditional non-parametric models, with the random forest model demonstrating the best performance among all models. Compared with the random forest model constructed using a single data source, combining Sentinel-2 and GF-6 data improved the inversion results of forest stock volume inversion performance, reducing the root mean square error (RMSE) of the models using Boruta by 7.41% and 9.61%, respectively. After terrain correction based on slope classification, the RMSE of the model decreased by 18.48%, and the spatial distribution of forest stock volume showed a high degree of consistency with the actual situation in Wangyedian Forest Farm.【Conclusion】Using Sentinel-2 and GF-6 as data sources, the constructed ensemble learning algorithms can more effectively estimate forest stock volume. Terrain correction based on slope classification significantly improves the estimation accuracy of forest stock volume.

关键词

森林蓄积量 / 遥感反演 / 联合数据源 / 地形校正 / 坡度分级

Key words

forest stock volume / remote sensing inversion / federated data source / topographic correction / slope classification

引用本文

导出引用
高佳乐, 蒋馥根, 龙依, . 基于坡度分级的旺业甸林场森林蓄积量反演[J]. 南京林业大学学报(自然科学版). 2025, 49(6): 13-25 https://doi.org/10.12302/j.issn.1000-2006.202410006
GAO Jiale, JIANG Fugen, LONG Yi, et al. Inversion of forest stock volume in Wangyedian Forest Farm based on slope classification[J]. Journal of Nanjing Forestry University (Natural Sciences Edition). 2025, 49(6): 13-25 https://doi.org/10.12302/j.issn.1000-2006.202410006
中图分类号: S758.51;TP751   

参考文献

[1]
周友锋, 谢秉楼, 李明诗. 基于随机森林协同克里金法的区域森林地上生物量制图——以粤北森林为例[J]. 南京林业大学学报(自然科学版), 2024, 48(1):169-178.
摘要
【目的】森林地上生物量(aboveground biomass,AGB)是森林生态系统健康状态和碳汇潜力评估的重要指标,本研究提出了一种快速、准确地获取区域尺度 AGB 信息的制图方法。【方法】基于 Landsat 5 TM、ALOS-1 PALSAR-1、STRM DEM和国家森林资源清查数据,提取光谱特征、纹理指数、后向散射系数和地形因子等特征因子,采用随机森林进行AGB建模。考虑到AGB是典型的具有空间自相关特性的生物物理参量,针对模型残差,使用以高程为协变量的克里金空间插值法分离残差项中的结构化成分,并将其叠加到随机森林模型预测值上形成最终的AGB预测值,从而提高区域尺度的AGB制图精度。【结果】协同克里金法将高程数据作为协变量,在预测AGB残差结构化成分方面的性能优于普通克里金法,协同克里金法与随机森林协同的AGB预测性能明显提升。经独立AGB数据的模型验证表明,随机森林模型预测的AGB与实际观测的AGB间的决定系数 R<sup>2</sup>为0.46,随机森林结合普通克里金的验证 R<sup>2</sup>提高到了0.51,而随机森林结合协同克里金模型的验证R<sup>2</sup>为0.57。相应的均方根误差(RMSE)分别从32.48 t/hm<sup>2</sup>降低到31.58、29.80 t/hm<sup>2</sup>,平均绝对误差(MAE)从27.28 t/hm<sup>2</sup> 降低到26.63、25.12 t/hm<sup>2</sup>,相对改进指数为0.03和0.08。【结论】总体而言,本研究提出的随机森林协同克里金模型提供了一种更准确、可靠地进行复杂地形区域的亚热带森林AGB制图新方法,所生成的AGB专题图有助于发展针对固碳效能的森林经营方法,为全球气候变化背景下的森林碳增汇和森林可持续经营提供参考。
ZHOU Y F, XIE B L, LI M S. Mapping regional forest aboveground biomass from random forest Co-Kriging approach: a case study from north Guangdong[J]. Journal of Nanjing Forestry University (Natural Sciences Edition), 2024, 48(1):169-178.DOI: 10.12302/j.issn.1000-2006.202202015.
[2]
周小成, 黄婷婷, 李媛, 等. 结合遥感林龄因子的亚热带森林蓄积量估算方法[J]. 林业科学, 2023, 59(4):88-99.
ZHOU X C, HUANG T T, LI Y, et al. A method for estimating subtropical forest stock by combining remotely sensed forest age factors[J]. Scientia Silvae Sinicae, 2023, 59(4):88-99.DOI: 10.11707/j.1001-7488.LYKX20210712.
[3]
巨一琳, 姬永杰, 黄继茂, 等. 联合LiDAR和多光谱数据森林地上生物量反演研究[J]. 南京林业大学学报(自然科学版), 2022, 46(1):58-68.
摘要
【目的】森林地上生物量的准确估测对于实时掌握全球碳储量变化及应对气候变化有着重要的意义。组合多种遥感数据特征优选,分类建模反演森林地上生物量,是提高森林地上生物量精度的有效方法。【方法】以根河市大兴安岭生态观测站寒温带天然林为研究对象,以机载激光雷达(LiDAR)、Landsat8 OLI两种遥感数据源结合55块地面调查数据,采用偏最小二乘算法优化筛选变量,再以线性多元逐步回归和快速迭代特征选择的最近邻算法(KNN-FIFS)构建模型,在两种数据源的不同组合方式下进行森林地上生物量反演。【结果】①基于线性多元逐步回归模型下的单一LiDAR数据反演精度决定系数(R<sup>2</sup>)为 0.76,均方根误差(RMSE)为 21.78 t/hm<sup>2</sup>;单一Landsat8 OLI数据的反演精度R<sup>2</sup>为 0.24,RMSE为39.27 t/hm<sup>2</sup>;LiDAR和Landsat8 OLI联合反演精度R<sup>2</sup> 为 0.84,RMSE为18.16 t/hm<sup>2</sup>;②基于KNN-FIFS模型下的单一LiDAR数据反演精度R<sup>2</sup>为 0.74,RMSE为23.83 t/hm<sup>2</sup>;单一Landsat8 OLI数据的反演精度R<sup>2</sup>为0.60,RMSE为 29.63 t/hm<sup>2</sup>;LiDAR和Landsat8 OLI联合反演精度R<sup>2</sup>为0.80,RMSE为21.15 t/hm<sup>2</sup>。【结论】①特征优选支持下的3种组合方式中,LiDAR和Landsat8 OLI两种数据的组合在两种模型中反演精度均最高,其中线性多元逐步回归模型的反演精度最高,说明LiDAR和Landsat8 OLI数据组合,激光雷达与光学数据优势特征互补,协同反演可有效提高森林地上生物量的反演精度;②单一数据源反演森林地上生物量精度中,LiDAR数据比Landsat8 OLI数据在两种模型反演精度中均较高,这与LiDAR数据空间分辨高、可获得垂直结构特征参数有关。
JU Y L, JI Y J, HUANG J M, et al. Inversion of forest aboveground biomass using combination of LiDAR and multispectral data[J]. Journal of Nanjing Forestry University (Natural Sciences Edition), 2022, 46(1):58-68.DOI: 10.12302/j.issn.1000-2006.202109029.
[4]
LIU Z H, LONG J P, LIN H, et al. Mapping and analyzing the spatiotemporal dynamics of forest aboveground biomass in the ChangZhuTan urban agglomeration using a time series of Landsat images and meteorological data from 2010 to 2020[J]. Science of The Total Environment, 2024,944:173940.DOI: 10.1016/j.scitotenv.2024.173940.
[5]
马永军, 张艺, 王广来, 等. 改进UNet++的遥感影像森林变化检测方法[J]. 森林与环境学报, 2024, 44(3):317-327.
MA Y J, ZHANG Y, WANG G L, et al. Improved forest change detection method for remote sensing imagery using UNet++[J]. Journal of Forest and Environment, 2024, 44(3):317-327.DOI: 10.13324/j.cnki.jfcf.2024.03.012.
[6]
CHEN J H, XU H Q. Analysis of the effectiveness of the red-edge bands of GF-6 imagery in forest health discrimination[J]. IEEE Journal of Selected Topics in Applied Earth Observations and Remote Sensing, 2024, 17:5621-5636.DOI: 10.1109/JSTARS.2024.3367320.
[7]
JIANG F G, SUN H, LI C J, et al. Retrieving the forest aboveground biomass by combining the red edge bands of Sentinel-2 and GF-6[J]. Acta Ecologica Sinica, 2021, 41(20):8222-8236.DOI: 10.5846/stxb202012173204.
[8]
YIN H, TAN B, FRANTZ D, et al. Integrated topographic corrections improve forest mapping using Landsat imagery[J]. International Journal of Applied Earth Observation and Geoinformation, 2022,108:102716.DOI: 10.1016/j.jag.2022.102716.
[9]
CHEN A, WANG X, ZHANG M, et al. Fusion of LiDAR and multispectral data for aboveground biomass estimation in mountain grassland[J]. Remote Sensing, 2023, 15(2):405.DOI: 10.3390/rs15020405.
[10]
LI M, IM J, BEIER C. Machine learning approaches for forest classification and change analysis using multi-temporal Landsat TM images over Huntington Wildlife Forest[J]. GIScience & Remote Sensing, 2013, 50(4):361-384.DOI: 10.1080/15481603.2013.819161.
[11]
PENG S F, WANG Z H, LU X P, et al. Hybrid inversion of radiative transfer models based on topographically corrected Landsat surface reflectance improves leaf area index and aboveground biomass retrievals of grassland on the hilly Loess Plateau[J]. International Journal of Digital Earth, 2024, 17(1):2316840.DOI: 10.1080/17538947.2024.2316840.
[12]
高永年, 张万昌. 遥感影像地形校正研究进展及其比较实验[J]. 地理研究, 2008, 27(2):467-477,484.
GAO Y N, ZHANG W C. Comparison test and research progress of topographic correction on remotely sensed data[J]. Geographical Research, 2008, 27(2):467-477,484.DOI: 10.3321/j.issn:1000-0585.2008.02.024.
[13]
SOENEN S A, PEDDLE D R, COBURN C A. SCS+C:a modified Sun-canopy-sensor topographic correction in forested terrain[J]. IEEE Transactions on Geoscience and Remote Sensing, 2005, 43(9):2148-2159.DOI: 10.1109/TGRS.2005.852480.
[14]
TEILLET P M, GUINDON B, GOODENOUGH D G. On the slope-aspect correction of multispectral scanner data[J]. Canadian Journal of Remote Sensing, 1982, 8(2):84-106.DOI: 10.1080/07038992.1982.10855028.
[15]
胡宇美, 马理辉, 李蕊, 等. 黄土高原地区森林生态系统地下生物量影响因素[J]. 生态学报, 2021, 41(21):8643-8653.
HU Y M, MA L H, LI R, et al. Factor analysis of underground biomass in forest ecosystem on the Loess Plateau[J]. Acta Ecologica Sinica, 2021, 41(21):8643-8653.DOI: 10.5846/stxb202008062046.
[16]
刘琪璟. 中国立木材积表[M]. 北京: 中国林业出版社, 2017.
LIU Q J. Tree volume tables of China[M]. Beijing: China Forestry Publishing House, 2017.
[17]
CHEN C, YUAN X P, GAN S, et al. A new vegetation index based on UAV for extracting plateau vegetation information[J]. International Journal of Applied Earth Observation and Geoinformation, 2024,128:103668.DOI: 10.1016/j.jag.2024.103668.
[18]
LI Q Y, LIN H, LONG J P, et al. Mapping forest stock volume using phenological features derived from time-serial Sentinel-2 imagery in planted larch[J]. Forests, 2024, 15(6):995.DOI: 10.3390/f15060995.
[19]
JIANG F G, KUTIA M, SARKISSIAN A J, et al. Estimating the growing stem volume of coniferous plantations based on random forest using an optimized variable selection method[J]. Sensors, 2020, 20(24):7248.DOI: 10.3390/s20247248.
Forest growing stem volume (GSV) reflects the richness of forest resources as well as the quality of forest ecosystems. Remote sensing technology enables robust and efficient GSV estimation as it greatly reduces the survey time and cost while facilitating periodic monitoring. Given its red edge bands and a short revisit time period, Sentinel-2 images were selected for the GSV estimation in Wangyedian forest farm, Inner Mongolia, China. The variable combination was shown to significantly affect the accuracy of the estimation model. After extracting spectral variables, texture features, and topographic factors, a stepwise random forest (SRF) method was proposed to select variable combinations and establish random forest regressions (RFR) for GSV estimation. The linear stepwise regression (LSR), Boruta, Variable Selection Using Random Forests (VSURF), and random forest (RF) methods were then used as references for comparison with the proposed SRF for selection of predictors and GSV estimation. Combined with the observed GSV data and the Sentinel-2 images, the distributions of GSV were generated by the RFR models with the variable combinations determined by the LSR, RF, Boruta, VSURF, and SRF. The results show that the texture features of Sentinel-2’s red edge bands can significantly improve the accuracy of GSV estimation. The SRF method can effectively select the optimal variable combination, and the SRF-based model results in the highest estimation accuracy with the decreases of relative root mean square error by 16.4%, 14.4%, 16.3%, and 10.6% compared with those from the LSR-, RF-, Boruta-, and VSURF-based models, respectively. The GSV distribution generated by the SRF-based model matched that of the field observations well. The results of this study are expected to provide a reference for GSV estimation of coniferous plantations.
[20]
SCHNEIDER P, ROBERTS D A, KYRIAKIDIS P C. A VARI-based relative greenness from MODIS data for computing the Fire Potential index[J]. Remote Sensing of Environment, 2008, 112(3):1151-1167.DOI: 10.1016/j.rse.2007.07.010.
[21]
SIMS D A, GAMON J A. Relationships between leaf pigment content and spectral reflectance across a wide range of species,leaf structures and developmental stages[J]. Remote Sensing of Environment, 2002, 81(2-3):337-354.DOI: 10.1016/S0034-4257(02)00010-X.
[22]
XU D W, WANG C, CHEN J, et al. The superiority of the normalized difference phenology index (NDPI) for estimating grassland aboveground fresh biomass[J]. Remote Sensing of Environment, 2021,264:112578.DOI: 10.1016/j.rse.2021.112578.
[23]
ZHANG T, GUAN H O, MA X D, et al. Drought recognition based on feature extraction of multispectral images for the soybean canopy[J]. Ecological Informatics, 2023,77:102248.DOI: 10.1016/j.ecoinf.2023.102248.
[24]
SUN H, WANG Q, WANG G X, et al. Optimizing kNN for mapping vegetation cover of arid and semi-arid areas using landsat images[J]. Remote Sensing, 2018, 10(8):1248.DOI: 10.3390/rs10081248.
[25]
BARALDI A, PARMIGGIANI F. An investigation of the textural characteristics associated with gray level cooccurrence matrix statistical parameters[J]. IEEE Transactions on Geoscience and Remote Sensing, 1995, 33(2):293-304.DOI: 10.1109/36.377929.
[26]
ZHANG L J, ZHAO Y Y, CHEN C, et al. UAV-LiDAR integration with Sentinel-2 enhances precision in AGB estimation for bamboo forests[J]. Remote Sensing, 2024, 16(4):705.DOI: 10.3390/rs16040705.
Moso bamboo forests, recognized as a distinctive and significant forest resource in subtropical China, contribute substantially to efficient carbon sequestration. The accurate assessment of the aboveground biomass (AGB) in Moso bamboo forests is crucial for evaluating their impact on the carbon balance within forest ecosystems at a regional scale. In this study, we focused on the Moso bamboo forest located in Shanchuan Township, Zhejiang Province, China. The primary objective was to utilize various data sources, namely UAV-LiDAR (UL), Sentinel-2 (ST), and a combination of UAV-LiDAR with Sentinel-2 (UL + ST). Employing the Boruta algorithm, we carefully selected characterization variables for analysis. Our investigation delved into establishing correlations between UAV-LiDAR characterization parameters, Sentinel-2 feature parameters, and the aboveground biomass (AGB) of the Moso bamboo forest. Ground survey data on Moso bamboo forest biomass served as the basis for our analysis. To enhance the accuracy of AGB estimation in the Moso bamboo forest, we employed three distinct modeling techniques: multivariate linear regression (MLR), support vector regression (SVR), and random forest (RF). Through this approach, we aimed to compare the impact of different data sources and modeling methods on the precision of AGB estimation in the studied bamboo forest. This study revealed that (1) the point cloud intensity of UL, the variables of canopy cover (CC), gap fraction (GF), and leaf area index (LAI) reflect the structure of Moso bamboo forests, and the variables indicating the height of the forest stand (AIH1, AIHiq, and Hiq) had a significant effect on the AGB of Moso bamboo forests, significantly impact Moso bamboo forest AGB. Vegetation indices such as DVI and SAVI in ST also exert a considerable effect on Moso bamboo forest AGB. (2) AGB estimation models constructed based on UL consistently demonstrated higher accuracy compared with ST, achieving R2 values exceeding 0.7. Regardless of the model used, UL consistently delivered superior accuracy in Moso bamboo forest AGB estimation, with RF achieving the highest precision at R2 = 0.88. (3) Integration of ST with UL substantially improved the accuracy of AGB estimation for Moso bamboo forests across all three models. Specifically, using RF, the accuracy of AGB estimation increased by 97.7%, with R2 reaching 0.89 and RMSE reduced by 124.4%. As a result, the incorporation of LiDAR data, which reflects the stand structure, has proven to enhance the accuracy of aboveground biomass (AGB) estimation in Moso bamboo forests when combined with multispectral remote sensing data. This integration serves as an effective solution to address the limitations of single optical remote sensing methods, which often suffer from signal saturation, leading to lower accuracy in estimating Moso bamboo forest biomass. This approach offers a novel perspective and opens up new possibilities for improving the precision of Moso bamboo forest biomass estimation through the utilization of multiple remote sensing sources.
[27]
郑佳佳, 周忠发, 朱孟, 等. 典型喀斯特山区的森林蓄积量遥感估算[J]. 水土保持通报, 2024, 44(2):176-186.
ZHENG J J, ZHOU Z F, ZHU M, et al. Remote sensing estimation of forest volume in typical Karst mountainous areas[J]. Bulletin of Soil and Water Conservation, 2024, 44(2):176-186.DOI: 10.13961/j.cnki.stbctb.2024.02.019.
[28]
WU Y S, ZHANG X L. Object-based tree species classification using airborne hyperspectral images and LiDAR data[J]. Forests, 2020, 11(1):32.DOI: 10.3390/f11010032.
[29]
ZHANG W F, ZHAO L X, LI Y, et al. Forest above-ground biomass inversion using optical and SAR images based on a multi-step feature optimized inversion model[J]. Remote Sensing, 2022, 14(7):1608.DOI: 10.3390/rs14071608.
Forest biomass change monitoring is essential for climate change. Synthetic aperture radar (SAR) and optimal remote sensing (RS) data are two very helpful data sources for forest biomass monitoring and estimation. During the procedure of biomass estimation using RS technique, optimal features selection and estimation models used are two critical steps. This paper therefore focuses on building an operational and robust method of biomass retrieval using optical and SAR RS data. First, random forest (RF) algorithms are used for reducing time-consuming and decreasing computational burden; then, an iterative procedure was embedded in K-nearest neighbor (KNN) algorithms for the best optimal feature selection and combination; last, the best feature combinations and KNN models were applied for forest biomass estimation. Moreover, forest type effects and RS feature source effects were considered. The results showed that feature combination of two optical images and the SAR image showed highest estimation accuracy by using the proposed algorithm (R2 = 0.70 for Forest-1, R2 = 0.72 for Forest-2, and R2 = 0.71 for Forest-3; RMSE = 16.18 Mg/ha for Forest-1, RMSE =17.66 Mg/ha for Forest-2, and RMSE = 18.67 Mg/ha for Forest-3, where Forest-1 is natural pure forests of Yunnan Pines, Forest-2 is natural mixed coniferous forests, and Forest-3 is the combination of Forest-1 and Forest-2). With the comparative analysis of proposed algorithm and different non-parametric algorithms, traditional nonparametric algorithms performed better in Forest-1, but worse in Forest-2 and Forest-3, while the proposed algorithm performed no obvious difference in three forest types and using five feature groups. The results revealed that the proposed algorithm was robust in biomass estimation, with almost no feature source and forest structure dependent for biomass estimation.
[30]
HUANG H J, WU D S, FANG L M, et al. Comparison of multiple machine learning models for estimating the forest growing stock in large-scale forests using multi-source data[J]. Forests, 2022, 13(9):1471.DOI: 10.3390/f13091471.
[31]
ZHANG N, CHEN M J, YANG F, et al. Forest height mapping using feature selection and machine learning by integrating multi-source satellite data in Baoding City,north China[J]. Remote Sensing, 2022, 14(18):4434.DOI: 10.3390/rs14184434.
Accurate estimation of forest height is crucial for the estimation of forest aboveground biomass and monitoring of forest resources. Remote sensing technology makes it achievable to produce high-resolution forest height maps in large geographical areas. In this study, we produced a 25 m spatial resolution wall-to-wall forest height map in Baoding city, north China. We evaluated the effects of three factors on forest height estimation utilizing four types of remote sensing data (Sentinel-1, Sentinel-2, ALOS PALSAR-2, and SRTM DEM) with the National Forest Resources Continuous Inventory (NFCI) data, three feature selection methods (stepwise regression analysis (SR), recursive feature elimination (RFE), and Boruta), and six machine learning algorithms (k-nearest neighbor (k-NN), support vector machine regression (SVR), random forest (RF), gradient boosting decision tree (GBDT), extreme gradient boosting (XGBoost), and categorical boosting (CatBoost)). ANOVA was adopted to quantify the effects of three factors, including data source, feature selection method, and modeling algorithm, on forest height estimation. The results showed that all three factors had a significant influence. The combination of multiple sensor data improved the estimation accuracy. Boruta’s overall performance was better than SR and RFE, and XGBoost outperformed the other five machine learning algorithms. The variables selected based on Boruta, including Sentinel-1, Sentinel-2, and topography metrics, combined with the XGBoost algorithm, provided the optimal model (R2 = 0.67, RMSE = 2.2 m). Then, we applied the best model to create the forest height map. There were several discrepancies between the generated forest height map and the existing map product, and the values with large differences between the two maps were mostly distributed in the steep areas with high slope values. Overall, we proposed a methodological framework for quantifying the importance of data source, feature selection method, and machine learning algorithm in forest height estimation, and it was proved to be effective in estimating forest height by using freely accessible multi-source data, advanced feature selection method, and machine learning algorithm.
[32]
IL H J. 基于集成学习的天然次生林地上生物量估测[D]. 哈尔滨: 东北林业大学, 2023.
IL H J. Aboveground biomass estimation of natural secondary forests based on ensemble learning algorithms[D]. Harbin: Northeast Forestry University, 2023.
[33]
蒋馥根, 孙华, ZHAO Feng, 等. 基于方差优化k最近邻法的森林蓄积量估测[J]. 森林与环境学报, 2019, 39(5):497-504.
JIANG F G, SUN H, ZHAO F, et al. Forest stock volume estimation based on a variance-optimized kNN model[J]. Journal of Forest and Environment, 2019, 39(5):497-504.DOI: 10.13324/j.cnki.jfcf.2019.05.008.
[34]
孙忠秋, 高金萍, 吴发云, 等. 基于机载激光雷达点云和随机森林算法的森林蓄积量估测[J]. 林业科学, 2021, 57(8):68-81.
SUN Z Q, GAO J P, WU F Y, et al. Estimating forest stock volume via small-footprint LiDAR point cloud data and random forest algorithm[J]. Scientia Silvae Sinicae, 2021, 57(8):68-81.DOI: 10.11707/j.1001-7488.20210807.
[35]
LIU X Q, SU Y J, HU T Y, et al. Neural network guided interpolation for mapping canopy height of China's forests by integrating GEDI and ICESat-2 data[J]. Remote Sensing of Environment, 2022,269:112844.DOI: 10.1016/j.rse.2021.112844.
[36]
HU Y, XU X L, WU F Y, et al. Estimating forest stock volume in Hunan Province,China,by integrating in situ plot data,Sentinel-2 images,and linear and machine learning regression models[J]. Remote Sensing, 2020, 12(1):186.DOI: 10.3390/rs12010186.
The forest stock volume (FSV) is one of the key indicators in forestry resource assessments on local, regional, and national scales. To date, scaling up in situ plot-scale measurements across landscapes is still a great challenge in the estimation of FSVs. In this study, Sentinel-2 imagery, the Google Earth Engine (GEE) cloud computing platform, three base station joint differential positioning technology (TBSJDPT), and three algorithms were used to build an FSV model for forests located in Hunan Province, southern China. The GEE cloud computing platform was used to extract the imagery variables from the Sentinel-2 imagery pixels. The TBSJDPT was put forward and used to provide high-precision positions of the sample plot data. The random forests (RF), support vector regression (SVR), and multiple linear regression (MLR) algorithms were used to estimate the FSV. For each pixel, 24 variables were extracted from the Sentinel-2 images taken in 2017 and 2018. The RF model performed the best in both the training phase (i.e., R2 = 0.91, RMSE = 35.13 m3 ha−1, n = 321) and in the test phase (i.e., R2 = 0.58, RMSE = 65.03 m3 ha−1, and n = 138). This model was followed by the SVR model (R2 = 0.54, RMSE = 65.60 m3 ha−1, n = 321 in training; R2 = 0.54, RMSE = 66.00 m3 ha−1, n = 138 in testing), which was slightly better than the MLR model (R2 = 0.38, RMSE = 75.74 m3 ha−1, and n = 321 in training; R2 = 0.49, RMSE = 70.22 m3 ha−1, and n = 138 in testing) in both the training phase and test phase. The best predictive band was Red-Edge 1 (B5), which performed well both in the machine learning methods and in the MLR method. The Blue band (B2), Green band (B3), Red band (B4), SWIR2 band (B12), and vegetation indices (TCW, NDVI_B5, and TCB) were used in the machine learning models, and only one vegetation index (MSI) was used in the MLR model. We mapped the FSV distribution in Hunan Province (3.50 × 10⁸ m3) based on the RF model; it reached a total accuracy of 63.87% compared with the official forest report in 2017 (5.48 × 10⁸ m3). The results from this study will help develop and improve satellite-based methods to estimate FSVs on local, regional and national scales.
[37]
武燕, 黄青, 刘讯, 等. 西南喀斯特地区马尾松人工林林龄对土壤理化性质的影响[J]. 南京林业大学学报(自然科学版), 2024, 48(3):99-107.
摘要
【目的】 了解西南喀斯特地区不同龄组马尾松(Pinus massoniana)人工林土壤理化性质变化,综合分析地形因子、林分特征及植物多样性指标对土壤性质的影响,为退化喀斯特地区环境治理提供参考。【方法】 在贵州省遵义市凤冈县,选取中龄林、近熟林和过成熟林3个龄组系列共11个马尾松人工林样地,样地按25.82 m&#x000D7;25.82 m方形设置,调查乔木层植物种名、高度及胸径,同时记录样地海拔、坡位、坡度及各样地主要物种组成,在每个样地的西南、西北、东北、东南、中共5个方位设置5个2 m&#x000D7;2 m的灌木样方,调查灌木层植物种名及株数,在每个灌木样方内设置1 m&#x000D7;1 m的草本样方,调查草本层植物种名和盖度,量化马尾松人工林土壤理化性质变化并分析其影响因子。【结果】 不同龄组之间马尾松人工林土壤容重、孔隙度、含水量、有机碳含量、全磷含量均无显著差异(P&gt;0.05),而全氮含量在[0,20)cm土层随林龄的增长呈先升高后降低,碱解氮含量在[20,40)cm土层随林龄的增长逐步降低,速效磷含量在[0,20)cm和[20,40)cm土层随林龄的增长呈先降低后升高的趋势(P&lt;0.05);马尾松人工林土壤容重、孔隙度和含水量在同一龄组[0,20)cm和[20,40)cm的两土层之间均无显著差异(P&gt;0.05),中龄林、近熟林和过成熟林的土壤有机碳含量、近熟林和过成熟林的全氮含量和碱解氮含量、过成熟林的全磷含量和速效磷含量在[0,20)cm和[20,40)cm两土层之间均有显著差异(P&lt;0.05),均随土层的加深而降低;相关性分析表明,地形因子、林分特征和植物多样性指标均是影响马尾松人工林土壤物理性质和养分变化的因素,逐步回归分析显示影响土壤物理性质变化的因素主要是林分密度和植物多样性指标,而地形因子、林分特征和植物多样性均是影响土壤养分的因素。RDA分析表明林分特征解释马尾松人工林土壤理化性质变异的36.60%,植物多样性解释土壤理化性质变异的27.00%,地形因子解释土壤理化性质变异的10.30%。【结论】 龄组变化对马尾松人工林土壤氮磷含量产生了显著影响,马尾松人工林的经营管理过程中应随着马尾松的生长发育适当添加氮肥和磷肥以维持马尾松人工林的生产力和可持续发展,而龄组变化对土壤物理性质没有显著影响,林分密度和树高是影响土壤理化性质变化的主要因子。
WU Y, HUANG Q, LIU X, et al. Effects of Pinus massoniana plantation age on soil physical and chemical properties in Karst areas in southwest China[J]. Journal of Nanjing Forestry University (Natural Science Edition), 2024, 48(3):99-107.DOI: 10.12302/j.issn.1000-2006.202210019.

基金

国家重点研发计划(2023YFD2201703)
国家自然科学基金项目(32471861)
国家自然科学基金项目(31971578)
湖南省科技创新计划(2023RC1065)
湖南省自然科学基金项目(2022JJ30078)

编辑: 李燕文
PDF(5119 KB)

Accesses

Citation

Detail

段落导航
相关文章

/